At Eurotrader, you can trade a wide range of financial instruments across multiple markets.
The MetaTrader platform provides three different chart types to help traders analyze financial instruments and their price movements over time. Although all charts are based on the BID price, they may present the data in different ways.
Types of Charts in MetaTrader:
🔹Line Chart
🔹Bar Chart
🔹Candlestick Chart
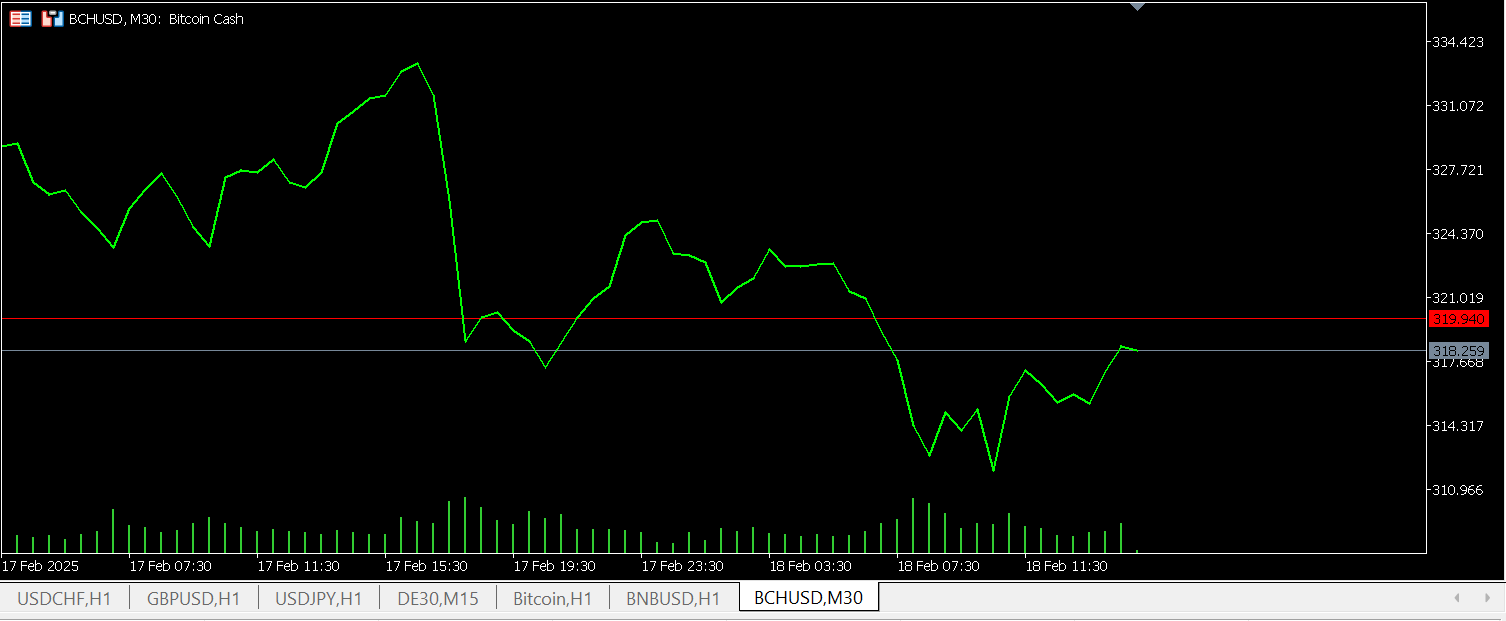
1. Line Chart
A line chart is the simplest type of chart. It connects closing prices over a selected time frame, making it easy to track price trends. For example, on an hourly chart, the line connects each hour’s closing price.
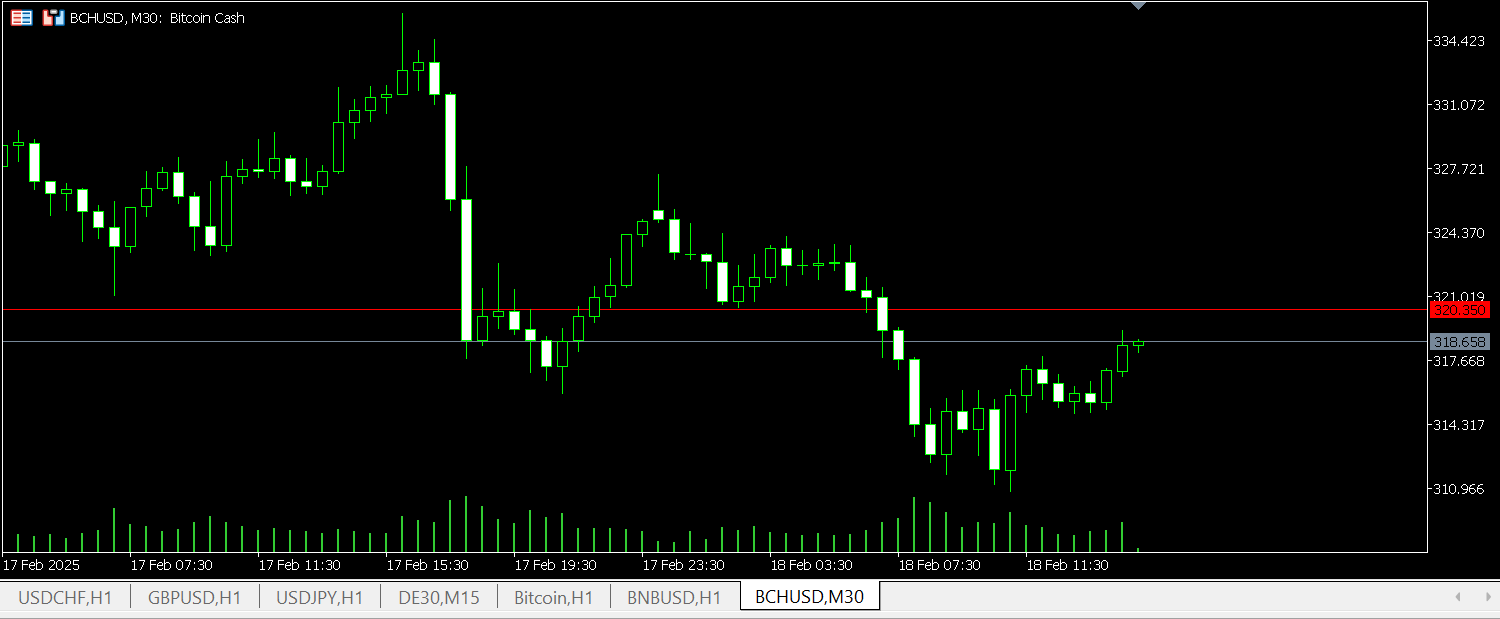
2. Candlestick Chart
A candlestick chart, also known as a Japanese candlestick chart, is visually more intuitive than a bar chart. Each "candle" represents a time period and is color-coded to show bullish (price increase) or bearish (price decrease) movement.
Each candlestick provides the following information:
- Opening price
- Closing price
- Highest price (upper wick)
- Lowest price (lower wick)
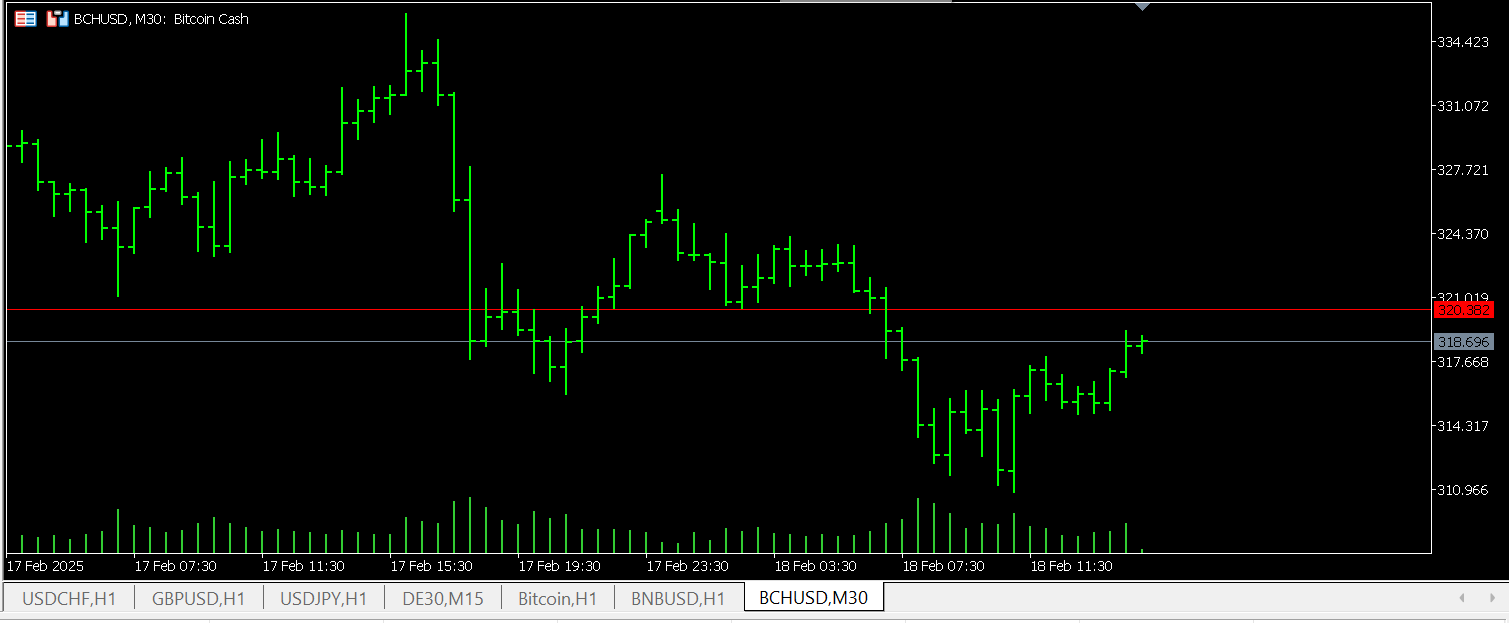
3. Bar Chart
A bar chart provides more details than a line chart by displaying:
- Opening price (left dash)
- Closing price (right dash)
- Highest price (top of the bar)
- Lowest price (bottom of the bar)
Bullish (Upward) Bars: Opening price (left) is lower than the closing price (right).
Bearish (Downward) Bars: Opening price (left) is higher than the closing price (right).
Tip: You can switch between chart types anytime by using the toolbar icons or the "Charts" menu in MetaTrader.
Need help? Our Customer support team is here to assist you.
Open an account with Eurotrader today!